
Satellite irrigation and water evidence · Alberta edition
See which fields were irrigated, season by season, and whether the water was there
Headgate maps which fields in Alberta's South Saskatchewan Basin were irrigated each season, 2021 to 2026, beside river flow and reservoir storage. As of Nov. 2026 it is the only annual, field-by-field satellite record we found, and it is built for irrigation districts. Pilot districts get their own results first, planned at no cost for one growing season.
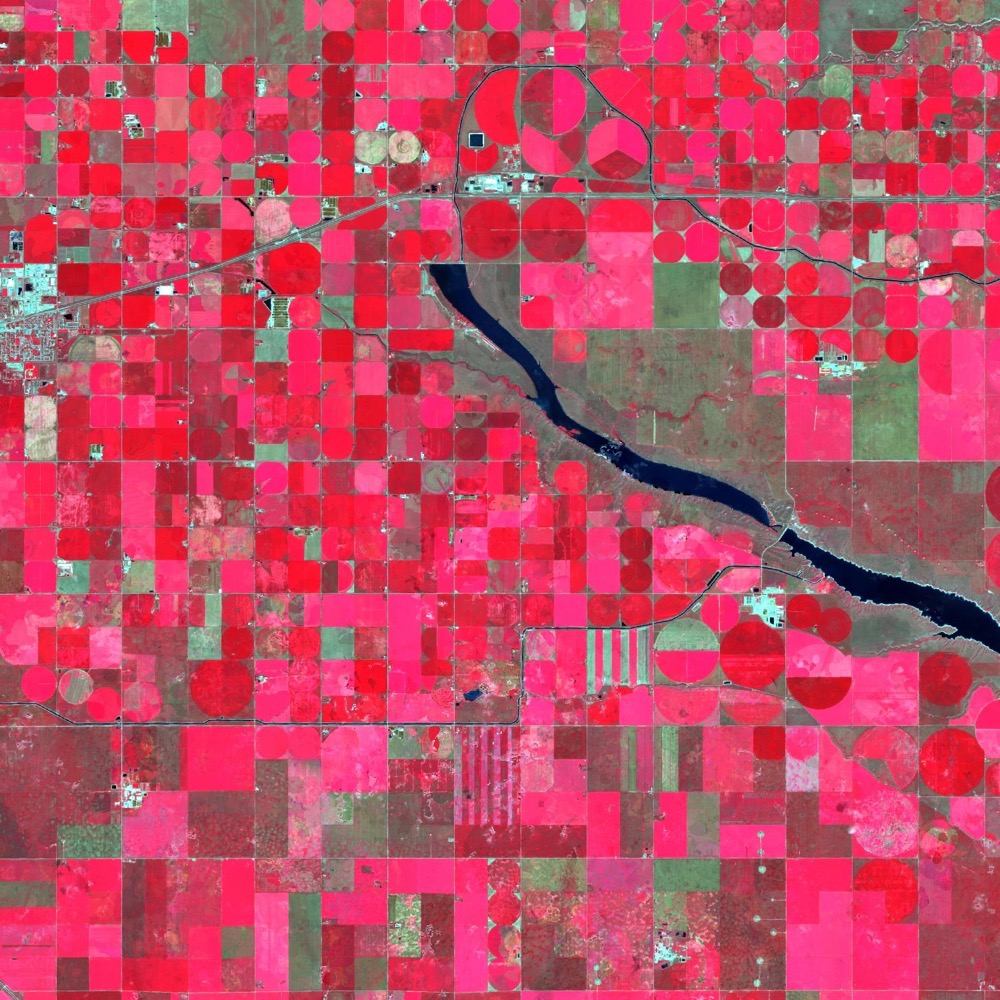
Every field, every season
115,864 mapped fields and six seasons, 2021 to 2026. Each gets a call (irrigated, not irrigated or undetermined) with a confidence rating; some stay undetermined, and wet seasons are harder.
The water beside it
River flow against the 1991–2020 normal for the same day, reservoir storage, mountain snow, the Canadian Drought Monitor class and a supply-risk rating (beta) for the basin.
Public data, each source named
Open government and satellite sources, so your team can check every figure.
Radar on the way
Sentinel-1 is in our monitoring view, and RADARSAT Constellation scenes for 2025 and 2026 are extracted for the whole basin.
The map
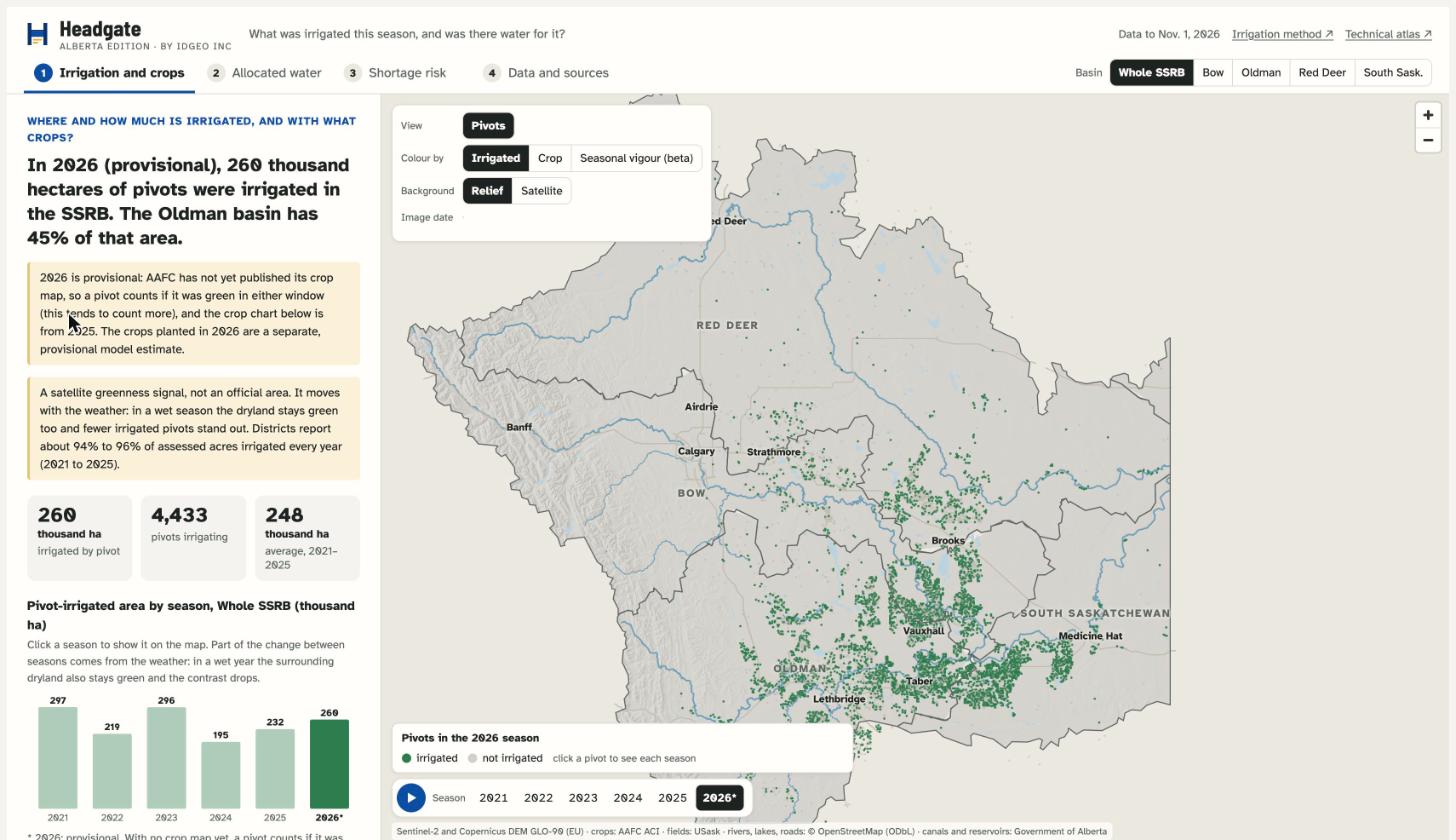
Explore the basin: irrigated pivots, reservoirs and the supply rating
The map opens full screen. Pick a season, a basin or a reservoir, and click a pivot to see each season. Each screen lists its sources and limits. It works best on a laptop or a larger screen.
Why it matters
The basin is closed to new licences, and irrigation is still expanding
Most of the water in the South Saskatchewan Basin is already allocated to irrigation. Decisions about sharing it in a dry year, expanding irrigation and transferring licences all depend on knowing how much water is actually used, and where.
Irrigation holds most of the water
Irrigation has 73.4% of allocations in the Bow and 83.5% in the Oldman (2023). The basin has had no new licences since 2006.
Expansion is funded
Government and the districts have funded a program of C$933 million to irrigate up to about 230,000 more acres, on water that is already allocated.
Shortage is not hypothetical
The Bow had its lowest flows on record in 2023, and the snow melted 4 to 5 weeks early. In April 2024, four voluntary water-sharing agreements were signed, the largest in the province's history.
Reporting of actual use is coming
The Water Amendment Act (Bill 7) received Royal Assent and requires licensees to report actual use. It takes effect only when proclaimed. First Nations and non-governmental organizations oppose it.
Nobody can yet see the use, field by field
We found no public tool that shows, by field and by district, how much water irrigation consumes and whether that fits within what was allocated. The last consolidated figure we found is from 2009: all sectors together used about 40% of the allocated volume in the basin, and irrigation made up about 84% of that use.
Headgate exists to put evidence at the scale where water is used, with its sources shown and its limits stated.
Sources: Government of Alberta; Water Survey of Canada; CBC; Western Producer; Alberta Wilderness Association; Mountain Life (interview with John Pomeroy, Jan. 2025).
The gap
To our knowledge, Alberta has no annual irrigation map by field
The government publishes irrigated totals by district, not by field. The global maps that cover Alberta each show a single year and have no local validation. That is the gap Headgate is built to fill.
| Source | Detail | Year | Limit |
|---|---|---|---|
| Alberta Irrigation Information (Government of Alberta) | By irrigation district | Annual series (we used 2007–2014) | Totals only, no field map. In 2007–2014, 84% to 92% of assessed acres were irrigated each year. |
| LGRIP30 (USGS and NASA) | 30 m, global | Nominal 2015; a 2020 version exists | One year, no local validation. |
| ESA WorldCereal | 10 m, global | 2021 | One year. In a rain-fed area near Vulcan it marks 36% of annual cropland as irrigated, so it overstates. |
| GMIA-NEXT | 30 m, global | 2023/24 season | One year. Not yet checked by us. |
| GIAM and GMIA | 9–10 km, global | One year | Too coarse to show a field. |
What Headgate adds
For every field and every season: irrigated, not irrigated or undetermined
Every mapped field gets an answer each season, with a confidence rating on each call. It combines crop greenness and surface temperature today, and radar is the next layer.
In development · validation under way- Radar. RADARSAT Constellation Mission, open analysis-ready data since 2025, revisiting about every 4 days over our test area. Scenes for 2025 and 2026 are extracted for the whole basin, and the radar model is the next build.
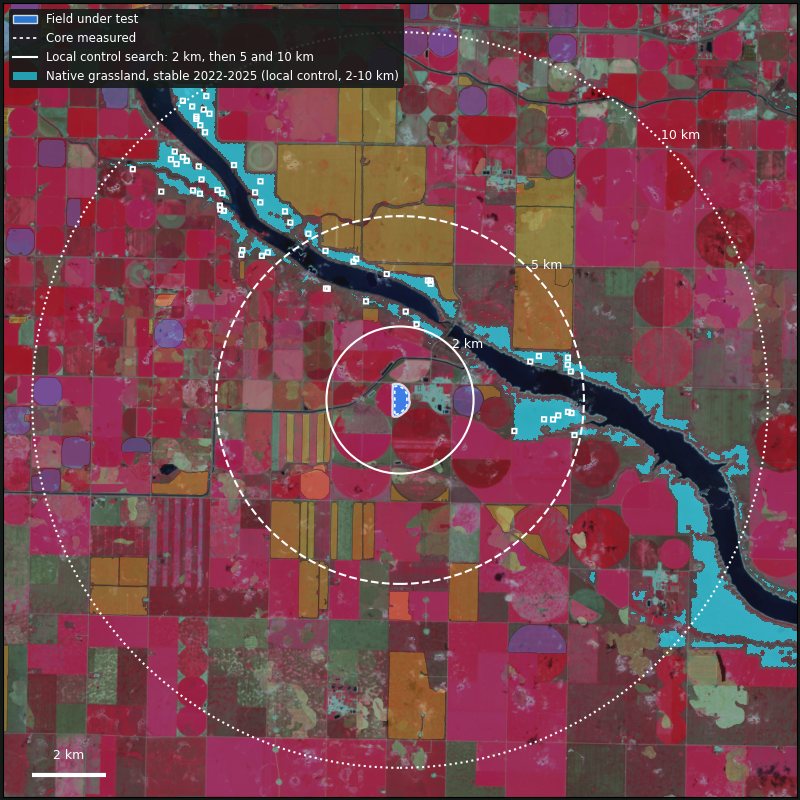
- Crop greenness. Sentinel-2 greenness compared with neighbouring natural vegetation, in the window when the season is most stressful.
- Surface temperature. Landsat thermal imagery.
The answer covers 115,864 mapped fields, with a confidence rating on each call. The seasonal pivot totals count centre pivots only. We froze a random sample of fields before anyone read it, and we will publish the validation result whatever it is.
Why the weather matters
The same land, a dry season and a wet one
Both views show the same area east of Lethbridge in the weeks our method reads (Sentinel-2 false colour, growing crops in red). From May to July 2023 about 77 mm of rain fell there; in 2024 about 203 mm (ERA5-Land).
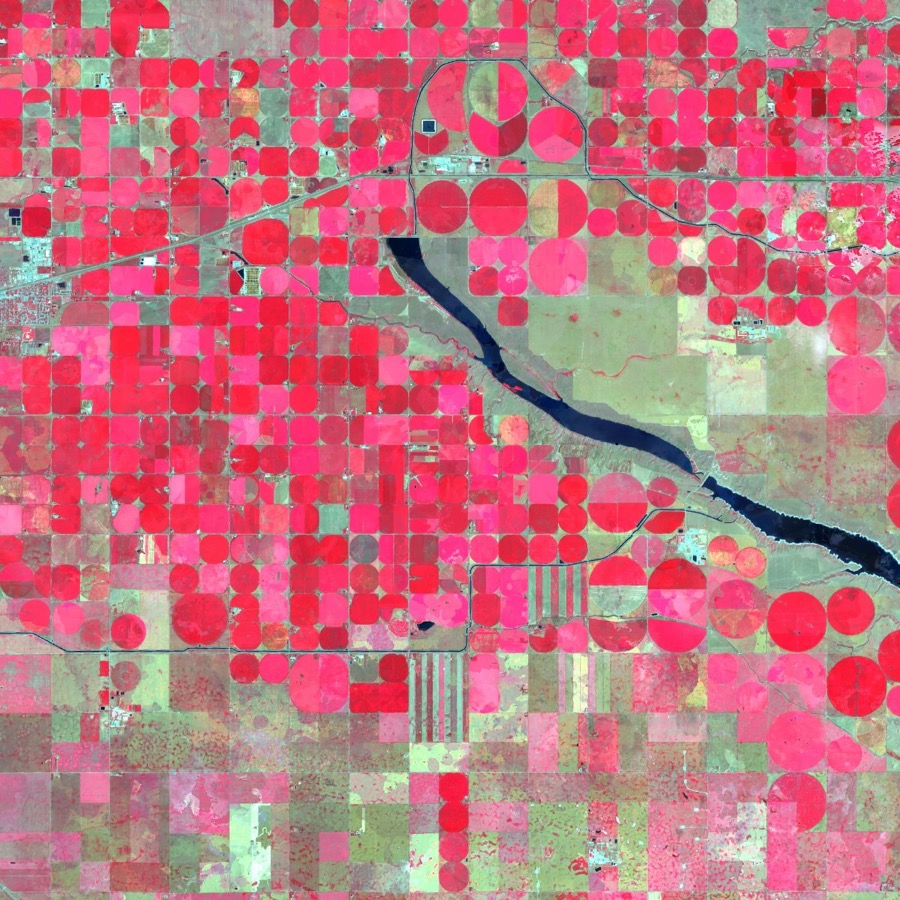
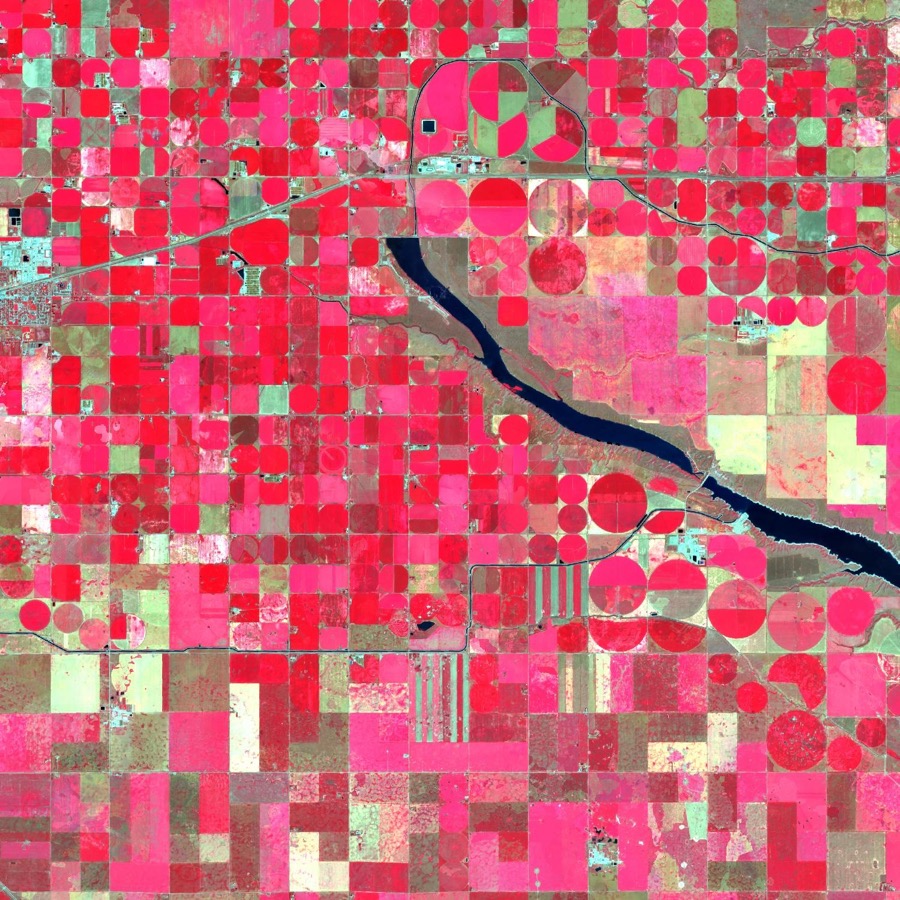
This is why Headgate compares each field with nearby land that is surely not irrigated and gives every call a confidence rating. Illustrative views of one location on different dates. Contains modified Copernicus Sentinel data (2023, 2024).
What Headgate answers
Three questions that public data answers only in part
The government publishes river flow, reservoir levels and drought classes. Headgate combines them with satellite and field data to answer the questions behind them.
Where is land irrigated, and is it growing?
Irrigated pivots by season, from 2021 to 2026, by basin. Next: detected area compared with the area each irrigation district assesses.
How much water does irrigation use against its allocation?
Crop water use (evapotranspiration), estimated field by field from satellite imagery and added up by district, shown as a share of the licensed volume. The last consolidated figure we found dates from 2009.
Is a water shortage coming this season?
A green, yellow or red rating for the basin, with the reason for the colour: river flow against the 1991–2020 normal for the same day, reservoir storage, mountain snow and the drought class.
Who it is for
Built first for the districts that deliver the water
Irrigation districts
Irrigated pivots by season, 2021 to 2026, mapped to your boundary once you share it, and later consumption against diversion.
Government and watershed councils
Use against allocation by sub-basin, early drought risk and a view of irrigation expansion.
Lenders, insurers and investors
A field-level history of irrigation, as a starting point. Use against allocation and reporting under the Water Amendment Act come later, if and when it is proclaimed.
Producers and agronomists
A simple map and an alert for their own fields.
Second phaseIn numbers
What grows on irrigated pivot fields: the 2025 crop map and the 2026 estimate
These are satellite estimates of crop type. They are not a measure of anyone's water use or licence compliance. See all the figures and their method.
The five main crops on pivot fields called irrigated
- Spring wheat2025: 63,900 ha2026: 57,700 ha
- Canola2025: 48,000 ha2026: 56,400 ha
- Barley2025: 32,700 ha2026: 31,300 ha
- Pasture and forage2025: 21,800 ha2026: 36,400 ha
- Corn for grain2025: 30,100 ha2026: 44,900 ha
2026 is a model estimate, so read the shape, not the change: AAFC's own 2026 map arrives in 2027. 2025 crops come from AAFC's Annual Crop Inventory. Hectares are whole fields on centre pivots that Headgate's answer called irrigated in each season; the irrigation calls of the two seasons use different rules, so this is not a measure of change in irrigation.
What exists today
A loaded data foundation behind the prototype
Also loaded: about 500 river flow stations with daily 1991–2020 normals, and reservoir storage history from about 2010. Field boundaries come from the University of Saskatchewan with corrections from Agriculture and Agri-Food Canada's Annual Crop Inventory. A daily refresh routine is built.
Method and limits
Built so the figures can be checked
Every figure names its source
Figures on this site name their sources, and every update keeps the earlier version.
Every call carries a confidence rating
Each field's answer comes with a reliability index, and we will publish the validation result on a methodology page, whatever it is, and share it with pilot districts first.
Beta, and open about it
Headgate is a beta. We froze a random sample of fields before anyone read it and will publish the validation when the human review is done; the supply-risk rating is checked on past seasons. Figures are estimates for planning, not measurements of any one licence.
Radar is the next layer
Cloud, smoke and snow hide optical imagery just when snow melts and crops are seeded. Radar sees through cloud and smoke, and snow affects it too. Sentinel-1 is already in our monitoring view (beta, together with each field's history), and RADARSAT Constellation scenes for 2025 and 2026 are extracted for the whole basin.
Evidence for planning
Headgate reports irrigated area and water supply to support planning. It does not label anyone's water use as illegal.
Not a government service
Headgate is published by IDGeo Inc. and builds on open data. It does not speak for any irrigation district or agency. For current river conditions, Alberta Rivers (rivers.alberta.ca) remains the official source.
Pilot districts
Bring season-by-season irrigation evidence to your district
The pilot is aimed at districts that want season-by-season satellite evidence of what is irrigated in their area. Your results come to you first.
Your data stays yours
Data you share is used only to validate and calibrate Headgate for your district and the basin. We will not share it with anyone, including government, unless you consent in writing or the law compels us, in which case we will tell you where we are permitted to. Service providers bound by confidentiality may process it for us. On your written request we delete your source data within an agreed period; results already derived may be kept in aggregate. Headgate is not a compliance tool. These are the intended terms: a written data agreement will set them out before any data is exchanged, and the pilot is planned as free for one growing season, with either side free to stop at any time.
What a district gets
- Pivot-level answers by season, 2021 to 2026, mapped to your boundary once you share it.
- A first season report, planned for the pilot.
- Crop water use against allocation, as the Oldman pilot matures.
What we ask for
- Your official boundary, so results map exactly to your area.
- Measured diversions, optional, to calibrate crop water use.
- About two hours of staff time to review a sample of pivots with us.
To join the pilot, write to headgate@idgeo.ca, or contact Ronan Campos at ronan@idgeo.ca or (368) 863-0636. You can also visit us at 37 Richard Way SW #200, Calgary, Alberta.
How you get it
One dashboard today, three more formats planned
- Web dashboard
- Map and charts by basin and pivot, with Sentinel-2 images of the 2025 and 2026 summers on chosen dates. Your fields on the map in a walkthrough; district views follow once your official boundary is shared. In the prototype
- Reports
- A season PDF for each district and a water-security sheet for each property. Planned
- API
- Read-only JSON and GeoJSON by unit and date, with data version and source on every record. Planned
- Alerts
- An email when flow, drought or likely allocation crosses a threshold you choose. Planned
Roadmap
From supply rating to water use, one question at a time
A phase moves on only when its new indicator has a recorded validation.
Data foundation and atlas
Fields, crops, checked pivots, licences, districts, flow and climate history.
Supply risk rating
Flow, reservoirs, snow and drought combined into a basin rating, being validated on past seasons. Radar surface water is next.
Irrigated area by district
District comparison once official boundaries are available, other irrigation systems and the first season report.
Consumption against allocation
Crop water use, piloted in the Oldman. Radar-based irrigation detection follows once the field-by-field method is validated.
Property sheet, water quality, L-band radar
The property sheet depends on the land registry and on the regulations of the Water Amendment Act. NISAR soil moisture follows the release of its archive, expected by the end of 2026.
About IDGeo Inc.
The only annual, field-by-field satellite irrigation record we found for Alberta
IDGeo Inc. builds satellite evidence on water and irrigation in Alberta, for agriculture and the environment, and is adding radar to it. We searched Government of Alberta, federal and global sources (Nov. 2026) and found no other satellite record of irrigation by field and by season for the South Saskatchewan Basin. Headgate tells you which fields in the South Saskatchewan River Basin were irrigated this season, and whether there was water for them. It combines public river, reservoir and licence data with satellite imagery, field by field, for 115,864 fields and six seasons (2021 to 2026).
Radar is the direction we are building in
Optical satellites go blind under cloud and smoke; in August 2026 smoke covered most of our test area on a clear-looking date. Radar sees through both, day and night. We already use Sentinel-1 radar in our in-season monitoring view, and we have extracted RADARSAT Constellation scenes for the whole basin, 313 in 2025 and 180 in 2026, at a revisit of about four days. We plan to build the in-season model on top of them.
- Why trust it. We are not a government service and we do not assess anyone's licence. Every figure carries its source and its limits.
- Where it stands. Headgate is in beta, with pilot districts getting the evidence first.
Next step
See your district's irrigation, season by season
The pilot is free, runs one season and your data stays under a written agreement. Ask for a walkthrough and we will take you through the map.
Ronan Campos · ronan@idgeo.ca · (368) 863-0636